3. Initial EDA (this week)
We have data! Now is the time to explore it and to make some initial models.
Instructions
Set-up
You can choose whether to use your RStudio cloud account or your own computers for this task (For RStudioCloud it seems that only one person can use a project effectively, so you’re welcome to use your shared space, but set up individual projects).
You can always copy/paste your final results together.
EVERYONE (individually)
Set up a project and get the data
Use Tutorial 2 to create a new project (or use a sensible existing project). If you are using the shared cloud space, work in individual projects. Keep following the tutorial to create a new .RmD file.
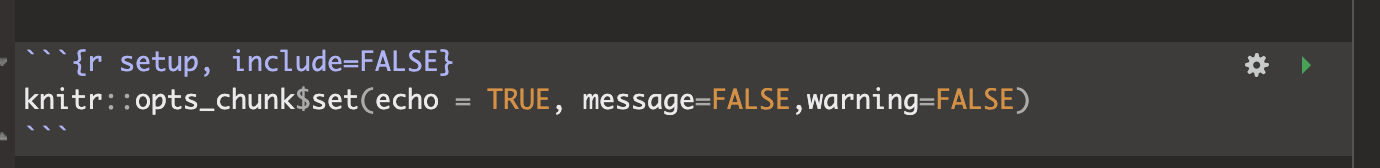
At the very top, either create or edit a code chunk that looks like this. This will stop the annoying library packages loading when you knit. Here’s the text to copy/paste:
{r setup, include=FALSE}
knitr::opts_chunk$set(echo = TRUE, message=FALSE,warning=FALSE)
- Below that, create a new code chunk to load these libraries. You might need to install some using Tutorial 2.2.
library(readxl) # read in data
library(sf) # spatial
library(sp) # spatial
library(raster) # spatial
library(terra) # spatial
library(tidyverse) # ALL
library(tmap) # mapping- Go to visual mode. Create a new header 1 called Exploratory Analysis
- Click this link to download the data: CLICK HERE. and put it in your project file. Use these commands to read it into R. The first one will create a data.frame (table) of your data. The second will create a “spatial version” that is easy to map. Press knit and check all is well.
DataIn <- read_excel("STAT462_TrainingData.xlsx")
DataIn <- na.omit(DataIn)
DataIn.sf <- st_as_sf(DataIn,coords=c( "X","Y"),crs="EPSG:32617")names(DataIn) [1] "Serial" "X"
[3] "Y" "Elevation_1m"
[5] "Slope_1m" "Roughness_1m"
[7] "Aspect_1m" "LandCover_Code"
[9] "NCLD_Percent_Tree_Cover" "NCLD_Percent_Concrete"
[11] "Date" "Hour"
[13] "Temp_F" "Light_Lux"
[15] "Notes" Open the data and take a look at it. (click on its name or put
View(DataIn)IN THE CONSOLE
You should see the following columnsSerial: the serial number of the item
X and Y. The location of the item in X and Y metre coordinates (Long/Lat coordinates are poor over small areas, so I’m using the WGS84 17N / Pennsylvania North map projection (https://epsg.io/32617))
Elevation_1m : The elevation of the sensor to the closest metre from the USGS 1 meter Digital Elevation Model
Slope_1m : The slope of the location where the sensor was placed, from the same USGS DEM
Aspect_1m : The aspect of the location where the sensor was placed., from the same USGS DEM
Roughness_1m : The roughness of the location where the sensor was placed, from the same USGS DEM
LandCover_Code: The NCLD landcover code for that location
NCLD_Percent_Tree_Cover: The percent tree cover for that location
NCLD_Percent_Concrete : The percent concrete at that location
Date: Date of the measurement
Hour: Hour of the measurement
Temp_F: The temperature measurement
Light_Lux: The Light measurement
Notes: Placement Notes
GROUP challenges
Now, there are several challenges that you can split as a group depending on your strengths.
Describing the data and the meta data. This means
Explaining the unit of analysis, the population and the variable
Researching and writing up why they have been “transformed” into UTM (hint: CLICK HERE)
Researching and writing about each of the predictor variables (e.g. a few sentences about what it is etc, google and the links above should help, or ask me questions on Teams)
Making summary statistics and plots of the
DataIntable. For exampleHow many sensors are there (hint, table command)
Any missing data?
Filtering the data to just one sensor, or one time of day (hint, this will really help: https://crd150.github.io/lab2.html#Data_Wrangling) and making a plot of the temperature over time, or say a histogram of the temps on a single day.
Filtering the data in other ways and making exploratory plots and histograms.
Quality controlling the data. For example,
Can you trust all the readings at all times of day? Can you see examples of where there are issues.
What about over all dates? Anything weird happening?
If you find things, decide whether you should keep or remove them AND WRITE DOWN WHAT YOU DID/CHANGED.
Using
DataIn.sfMake some initial maps, especially of static variables that don’t change over time.You could use QTM from the previous lab, for example
tmap_mode("view")
qtm(DataIn.sf,
dots.col="NCLD_Percent_Tree_Cover")+
tm_layout(legend.outside = TRUE)