include_graphics("./Figures/State College Township.png")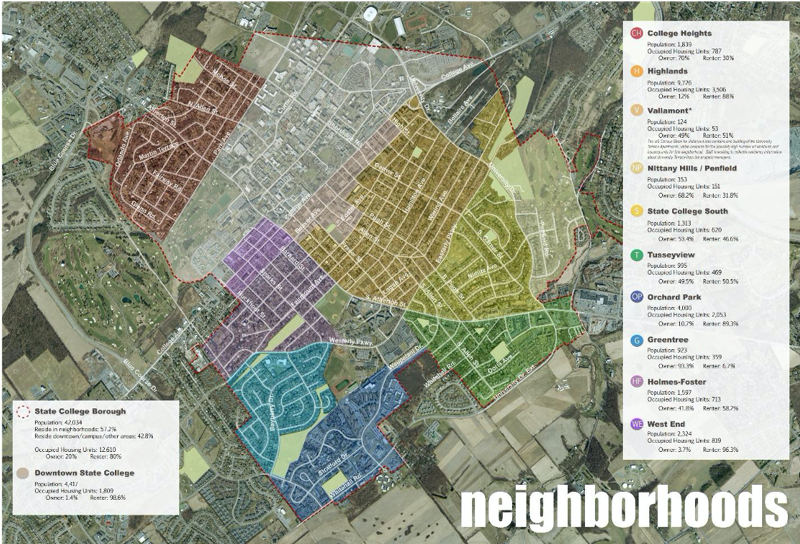
Some of you will become future topic experts, for example rainfall or forest or finance specialists who get to design experiments and surveys. But many of you might become “general data scientists” so it’s important to be able to sensibly set up a study even on a topic you know little about with training data you didn’t get to collect.
With this in mind, I have chosen a topic I know a lot about and most of you are newer to, temperature measurements.
During the semester we will be working on a group project of “messy data”. I have a strange request from Jere Northridge who is a State College town council Township Engineer. He would like to predict where in the state college township is the coldest place at Midnight on May-1. (for reasons..)
I put out many temperature sensors to make a training dataset. You will be creating a series of regression models to see if you can understand it, then predict the location in College Township with the coldest temperature at midnight on the Monday May 1st.
Your unit of analysis is a specific measurement from a mini sensor. E.g.. a measurement at location X on date/Time Y.
Your spatial population of interest is State College Township
include_graphics("./Figures/State College Township.png")
To create our supervised model, I will provide as much training data as I can. This will be temperature sensor measurements from around the entire State College area. You will have to quality control this, add in meta data and create your models.
We will be writing up the following as a consultancy style professional report in R-Markdown. The report will be submitted individually, but there are several areas you are allowed to create together as a group.
Developing a causal assessment of a model
Quality control and exploratory data analysis
Each of you will take a separate predictor and make/validate/assess the best SLR model you can. You will be predicting the coldest location at midnight on Monday May 1st in within State College borough/township,
You will assess the best MLR model you can
Go wild with your final model choice, we can also look at non-regression options.
Each group will get some temperature sensors to place in the spot you think is the coldest on May-1.
You are not being graded on the “best” model, you are being graded on creating a valid and sensible analysis with the information you have and with a write-up that clearly explains all techniques and results to a non-expert.