Lab 6
Aim
Welcome to lab 6. This is worth (100 points)
By the end of this lab, you will be able to:
- Completely work through simple linear regression
- Conduct an exploratory logistic regression analysis
This is a TWO WEEK LAB (e.g. 3 weeks total). You need to finish writing up by Tues April 16th 23:59pm. The maximum time this lab should take is about 8-10 hrs of your time.
Need help?
REMEMBER THAT EVERY TIME YOU RE-OPEN R-STUDIO YOU NEED TO RE-RUN ALL YOUR CODE CHUNKS. The easiest way to do this is to press the “Run All” button (see the Run menu at the top right of your script)
Code won’t knit? Struggling? Have a question? See the help page here: Help!
1. IMPORTANT! Re-install OLSRR
Our regression package has had an important update and I want you to all install the development package. To do this, open R-Studio and copy/paste this code into the CONSOLE.
install.packages("remotes")
library(remotes)
install_github("rsquaredacademy/olsrr")

# When you run this, it will ask if you want to update your other packages in the console.  Type 2 (e.g. just update CRAN packages) into the console and press enter.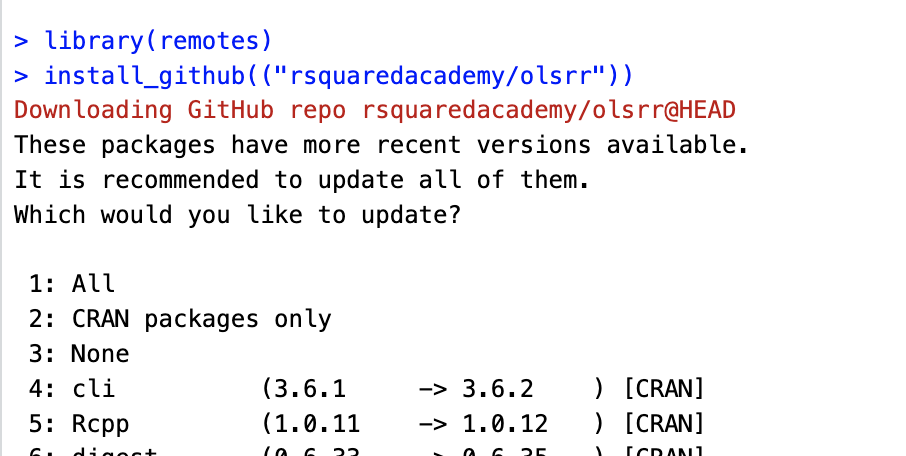
Press 2, then enter in the console.
2. Set up (DON’T SKIP)
[Step 2.1] Create a new project for Lab 6
- I am assuming you now know how to do this. See previous labs and the tutorial
[Step 2.2] Go to Canvas and get your personalised data.
- In Canvas, you will see three datasets. Put them in your project folder
[Step 2.3] Go to Canvas and get your lab report template
I have provided a template for your answers to make life simple.
Inside this template, I have summarized all the linear regression code in a bundle that you can copy/paste. This is the bundle I use all the time in my work.
Put the template in your project folder, open it and edit the ‘read in data’ code chunk to read in your three individual files. It should now knit.
3. Simple Linear Tutorial (week 1)
We have now reached the end of simple linear regression and as we tend to do the same things over and over again, and I want you to make yourself a reference guide similar to Question 4 in homework 6. To get you fast feedback, I am going to grade this using a canvas quiz! (keep reading)
[Step 3.1] Weight loss challenge - READ THIS!
You just need to read the text for this step.
I have been asked to lose weight for health reasons and I’m trying to decide the right strategy. Watching TV yesterday, I heard about two methods:
The Great Hair Challenge: I could just pull a single hair from my head and I would lose weight! In fact, the more hairs I remove, the more weight I lose.
The Milkshake Challenge: There is a new milkshake diet. The longer I stick to the diet, the more I lose weight.
To help decide what to do, I managed to find some prior research:
The dataset weight_hair contains data on 50 test-subjects across a variety of hair types. While standing on a weighing scale, each person removed a randomly pre-assigned number of hairs from their head and recorded their weight loss (in micro-grams). Negative values mean they LOST weight, positive means they gained weight.
The dataset weight_diet contains data on 50 test-subjects who took the milkshake diet. Each person stayed on the diet for a randomly pre-assigned number of days and at the end, recorded their weight loss (in pounds). Negative values mean they LOST weight, positive means they gained weight.
[Step 3.2] The Great Hair Challenge
In your write-up template, I have provided you with all the code needed to conduct a linear regression analysis.
Copy the code bundle into the appropriate spot in your write up.
Get the code working to make a liner model that assesses whether removing hairs from your head leads to weight loss - along with professional scatterplots and model diagnostics. You do not need to apply any transformations or remove any outliers.
Underneath this analysis, I asked some questions. Fill in the answers in the space provided along with as much detail as you can (e.g. use this as your revision notes)
[Step 3.3] The Milkshake Challenge
Copy the code bundle a second time into the appropriate spot in your write up.
Get the code working to make a liner model that assesses whether removing hairs from your head leads to weight loss - along with professional scatterplots and model diagnostics.
Underneath this analysis, I asked some questions. Fill in the answers in the space provided along with as much detail as you can (e.g. use this as your revision notes)
4. Logistic Regression TUTORIAL RELEASED)
We are now moving onto the case where your response variable isn’t numeric continuous.
https://psu-spatial.github.io/Stat462-2024/S.Tutorial_GLM.html
With the objective of understanding more about spiders, a researcher has collected data on sand grain size on 28 beaches in Japan and observed the presence or absence of the burrowing wolf spider on each beach. The resulting data is held in your spider dataset
Use Tutorial 14 (NOW UPLOADED) and the online tutorial (https://online.stat.psu.edu/stat501/lesson/13/13.2) and this week’s lecture notes to create a model and answer the questions.
5. Submitting your Lab - NEW!
Remember to save your work throughout and to spell check your writing (next to the save button). Now, press the knit button again. If you have not made any mistakes in the code then R should create a html file in your lab 6 folder which includes your answers.
To make grading faster, I would like you to enter your answers on a Canvas quiz. You will be copy/pasting from your answers here. See Canvas for more.
Congrats! You are done.
Overall, here is what your lab should correspond to: