7 Correlation
7.1 Basics
To find the correlation between two variables, you can simply use the cor function e.g.
cor(HousesNY$Price,HousesNY$Beds)## [1] 0.4191355To see the correlation between ALL columns we can make a “correlation matrix”
Importantly, remember this website - https://www.tylervigen.com/spurious-correlations. Just because another variable is correlated with our response does not mean it HAS to be in the model. It simply means that you might want to consider whether there is a reason for that correlation.
Also, the correlation is a measure of the LINEAR relationship between two values… All of these scatterplots have the same correlation! (meet the datasaurus)

As you can see better in this gif
7.2 Covariance/Correlation matrix plots
Looking at correlations is a quick (but often misleading) way to assess what is happening. Essentially we can look at the correlation between each column of data. You can simply look at the correlations of any NUMERIC columns using the corrplot code.
library(corrplot)

# Filter to a new data frame with only numeric columns
house.numeric.columns <- HousesNY[ , sapply(HousesNY,is.numeric)]
corrplot(cor(house.numeric.columns),method="ellipse",type="lower")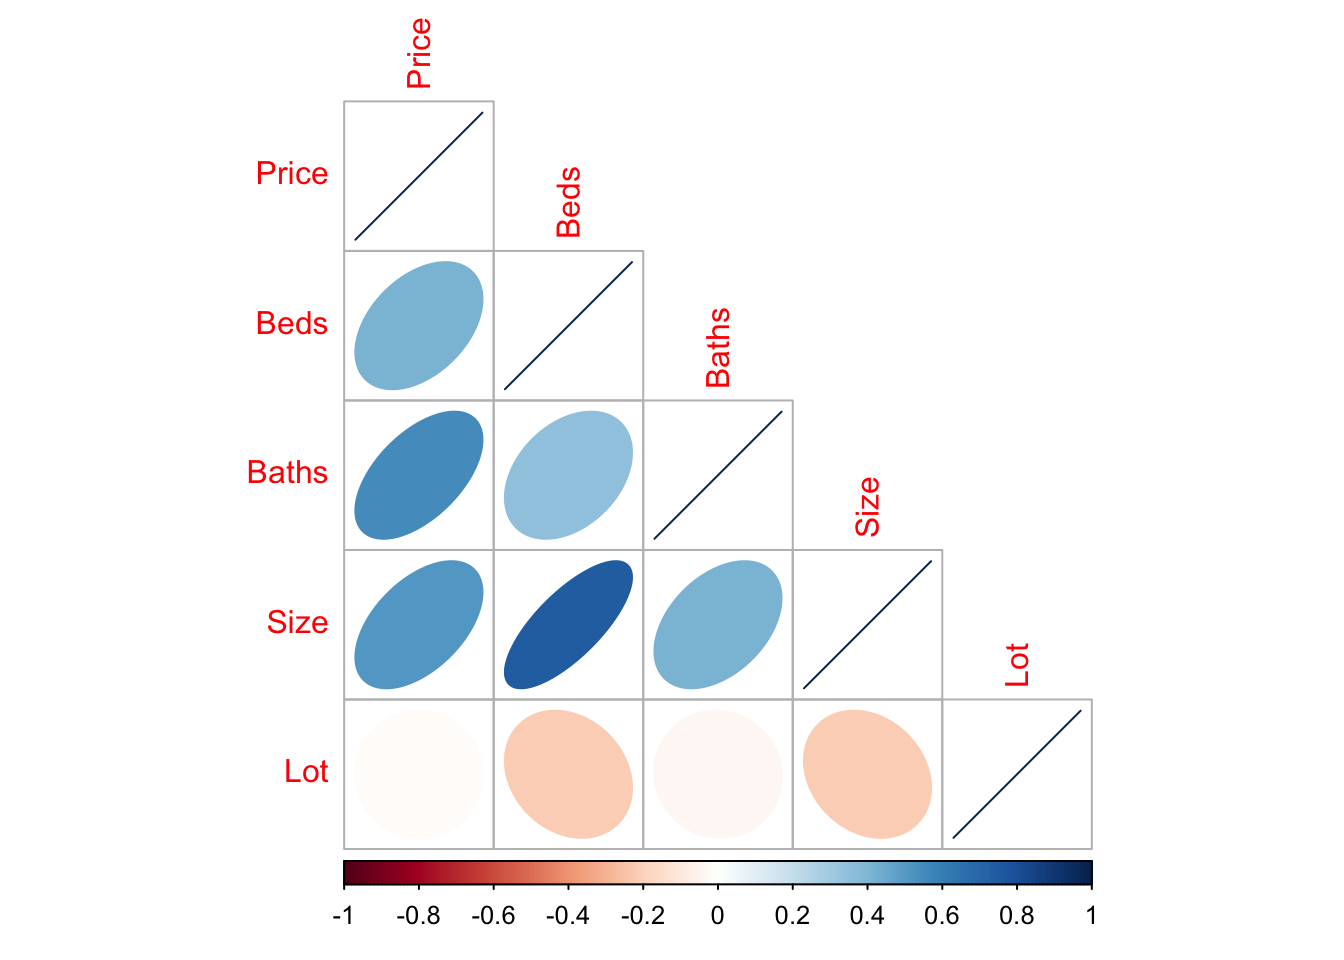
Another one is in the ggstatsplot package - https://indrajeetpatil.github.io/ggstatsplot/articles/web_only/ggcorrmat.html many more examples here.
library(ggstatsplot)
ggcorrmat(HousesNY)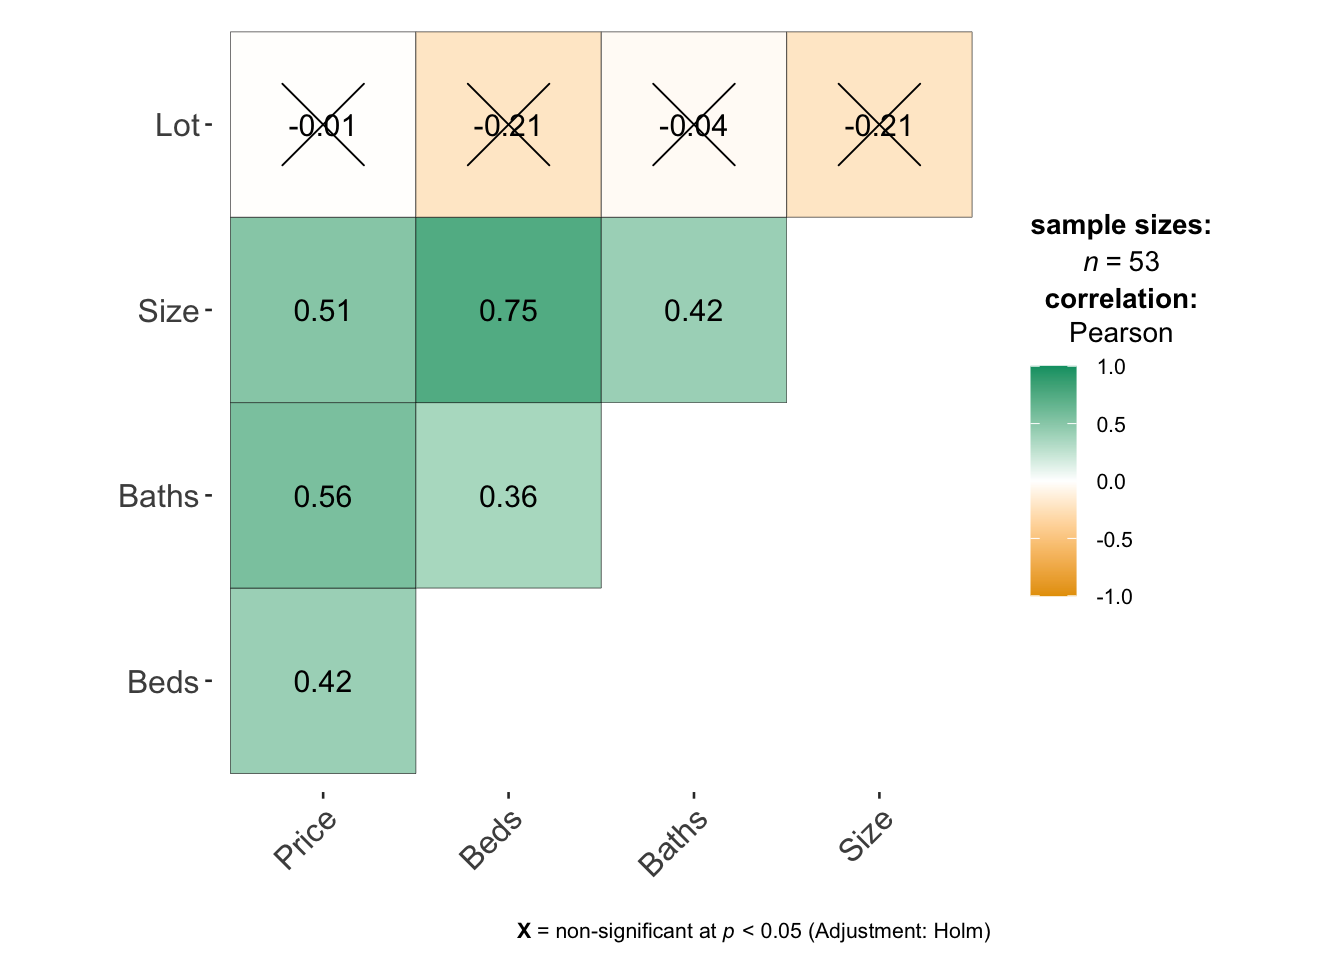
There are LOADS of other ways to run correlation plots here: https://www.r-graph-gallery.com/correlogram.html Feel free to choose a favourite.
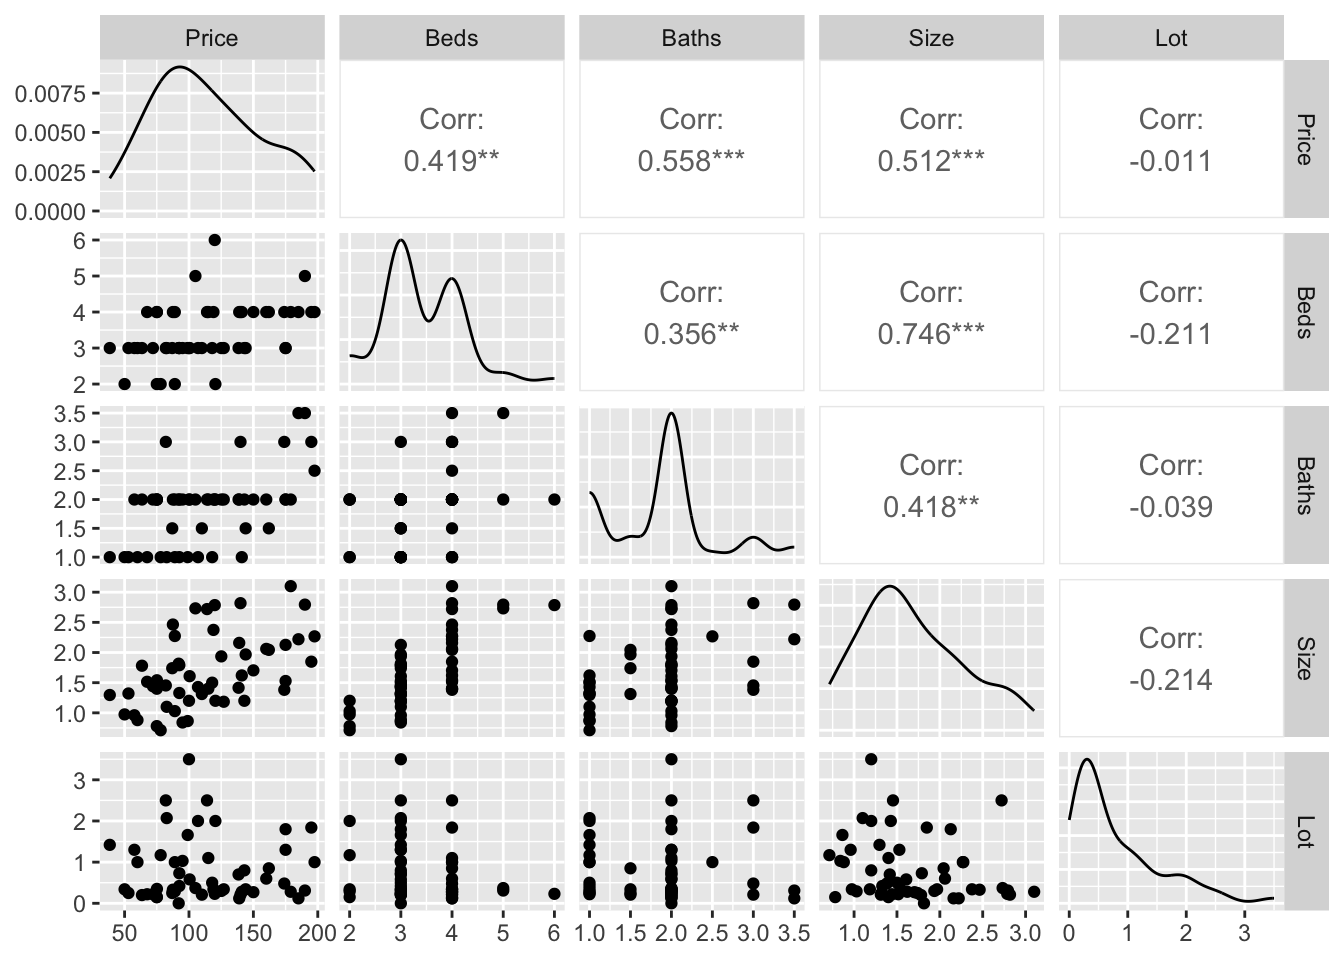
For example, GGALLY does this with its ggpairs command. But it doesn’t like working on large datasets.
# Choose column names - let's say I don't care about location
colnames(HousesNY)
## [1] "Price" "Beds" "Baths" "Size" "Lot"
# Create plot - note I have message=TRUE and warning=TRUE turned on at the top of my code chunk
ggpairs(HousesNY[,c("Price","Beds" ,"Baths","Size" , "Lot"   )])