Lab 3
LAB AIM
Welcome to Lab 3. This is worth 8% (80 points) and you can drop your lowest lab out of six.
This is a ONE WEEK LAB. You only have one lab session (today) working on this during class, then until next Friday to finish up and write up. The maximum time it should take is about 4-5 hrs of your time.
1. LAB SET-UP (Important!)
STEP 1: IMPORTANT - Create a Lab 3 project..
You need a separate project for every lab!
[1A] Go here to read more about projects and to make a project for Lab 3: Projects
[1B] If you haven’t already, open your project in R-Studio. It should look like this, but say Lab 3 for everything.
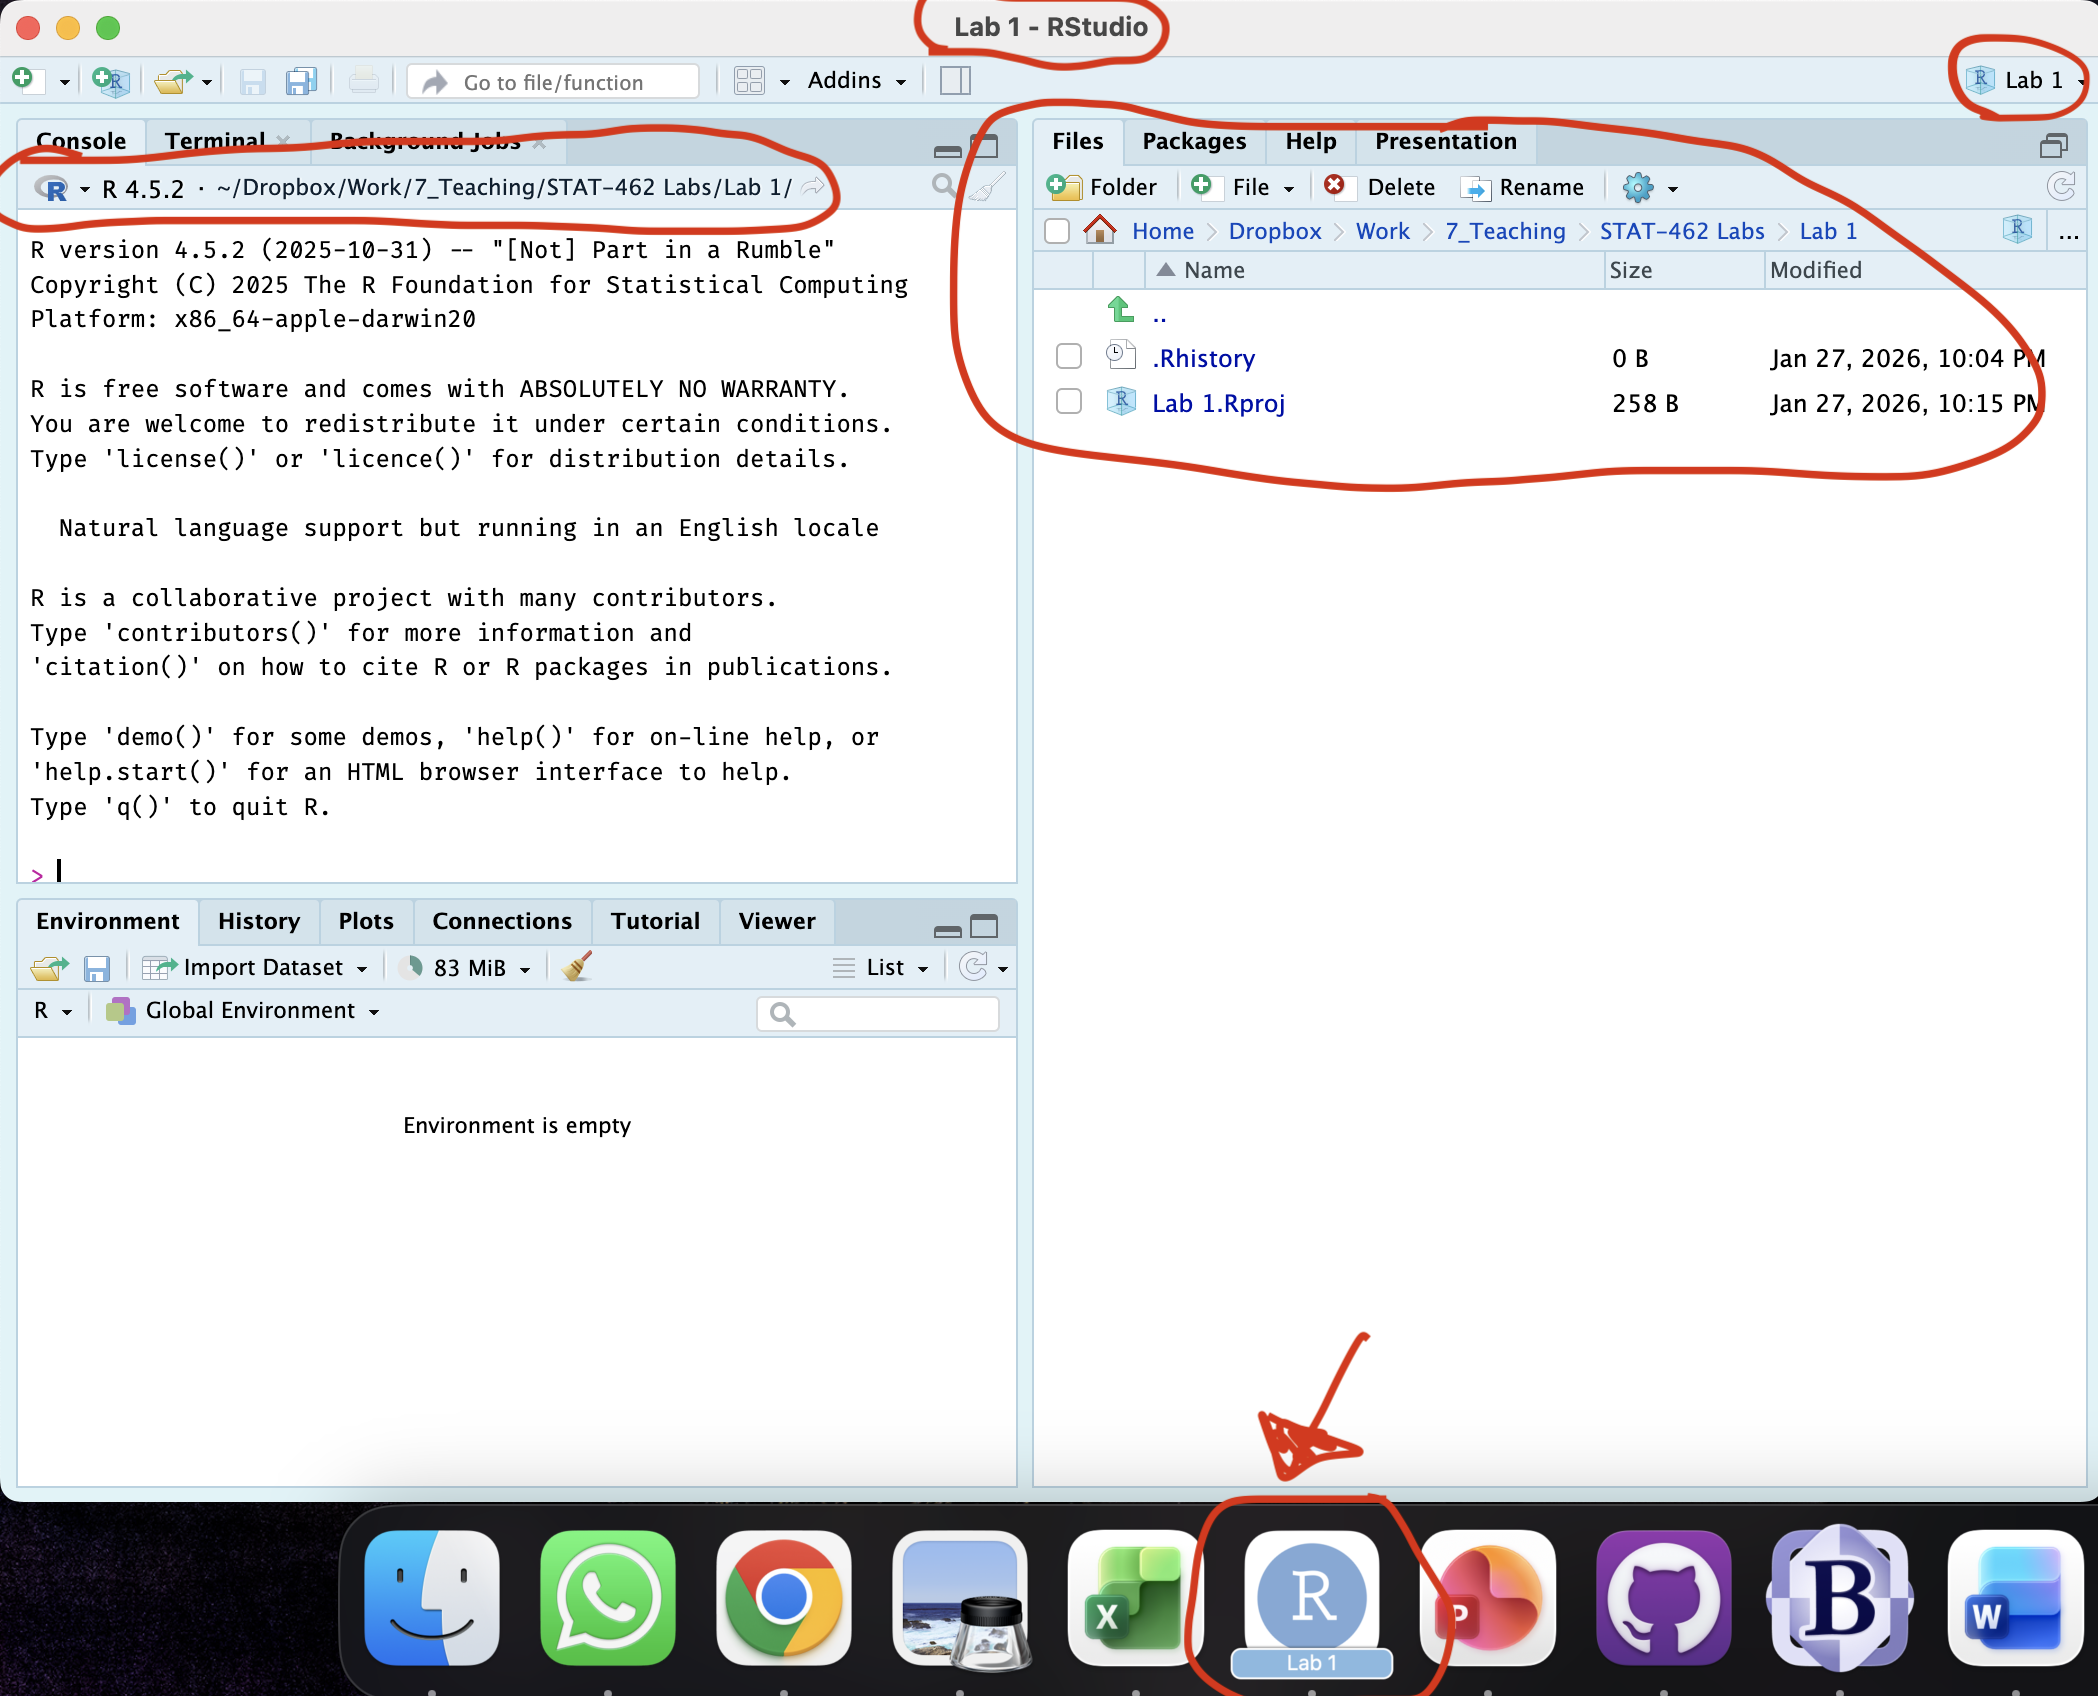
Figure 0.13: How to check you are in a project
STEP 2: Download code-Packages from the app store..
Today we need a few new libraries/apps. Just like last week, select and install the ones you need from the “app store”
-
[2A] Follow the instructions here (Installing Packages) to go to the ‘install/app store’ and install these package(s):
olsrr
We will load and use them later in the lab.
STEP 3: Create your lab report structure
[3A] Using the tutorial instructions, make a new RMarkdown Report (Markdown Tutorial)
[3B] Open your RmD report file (click on its name in the files tab, as long as you are running your project). Click visual mode and see if you can identify the code chunks, space for text and yaml files.
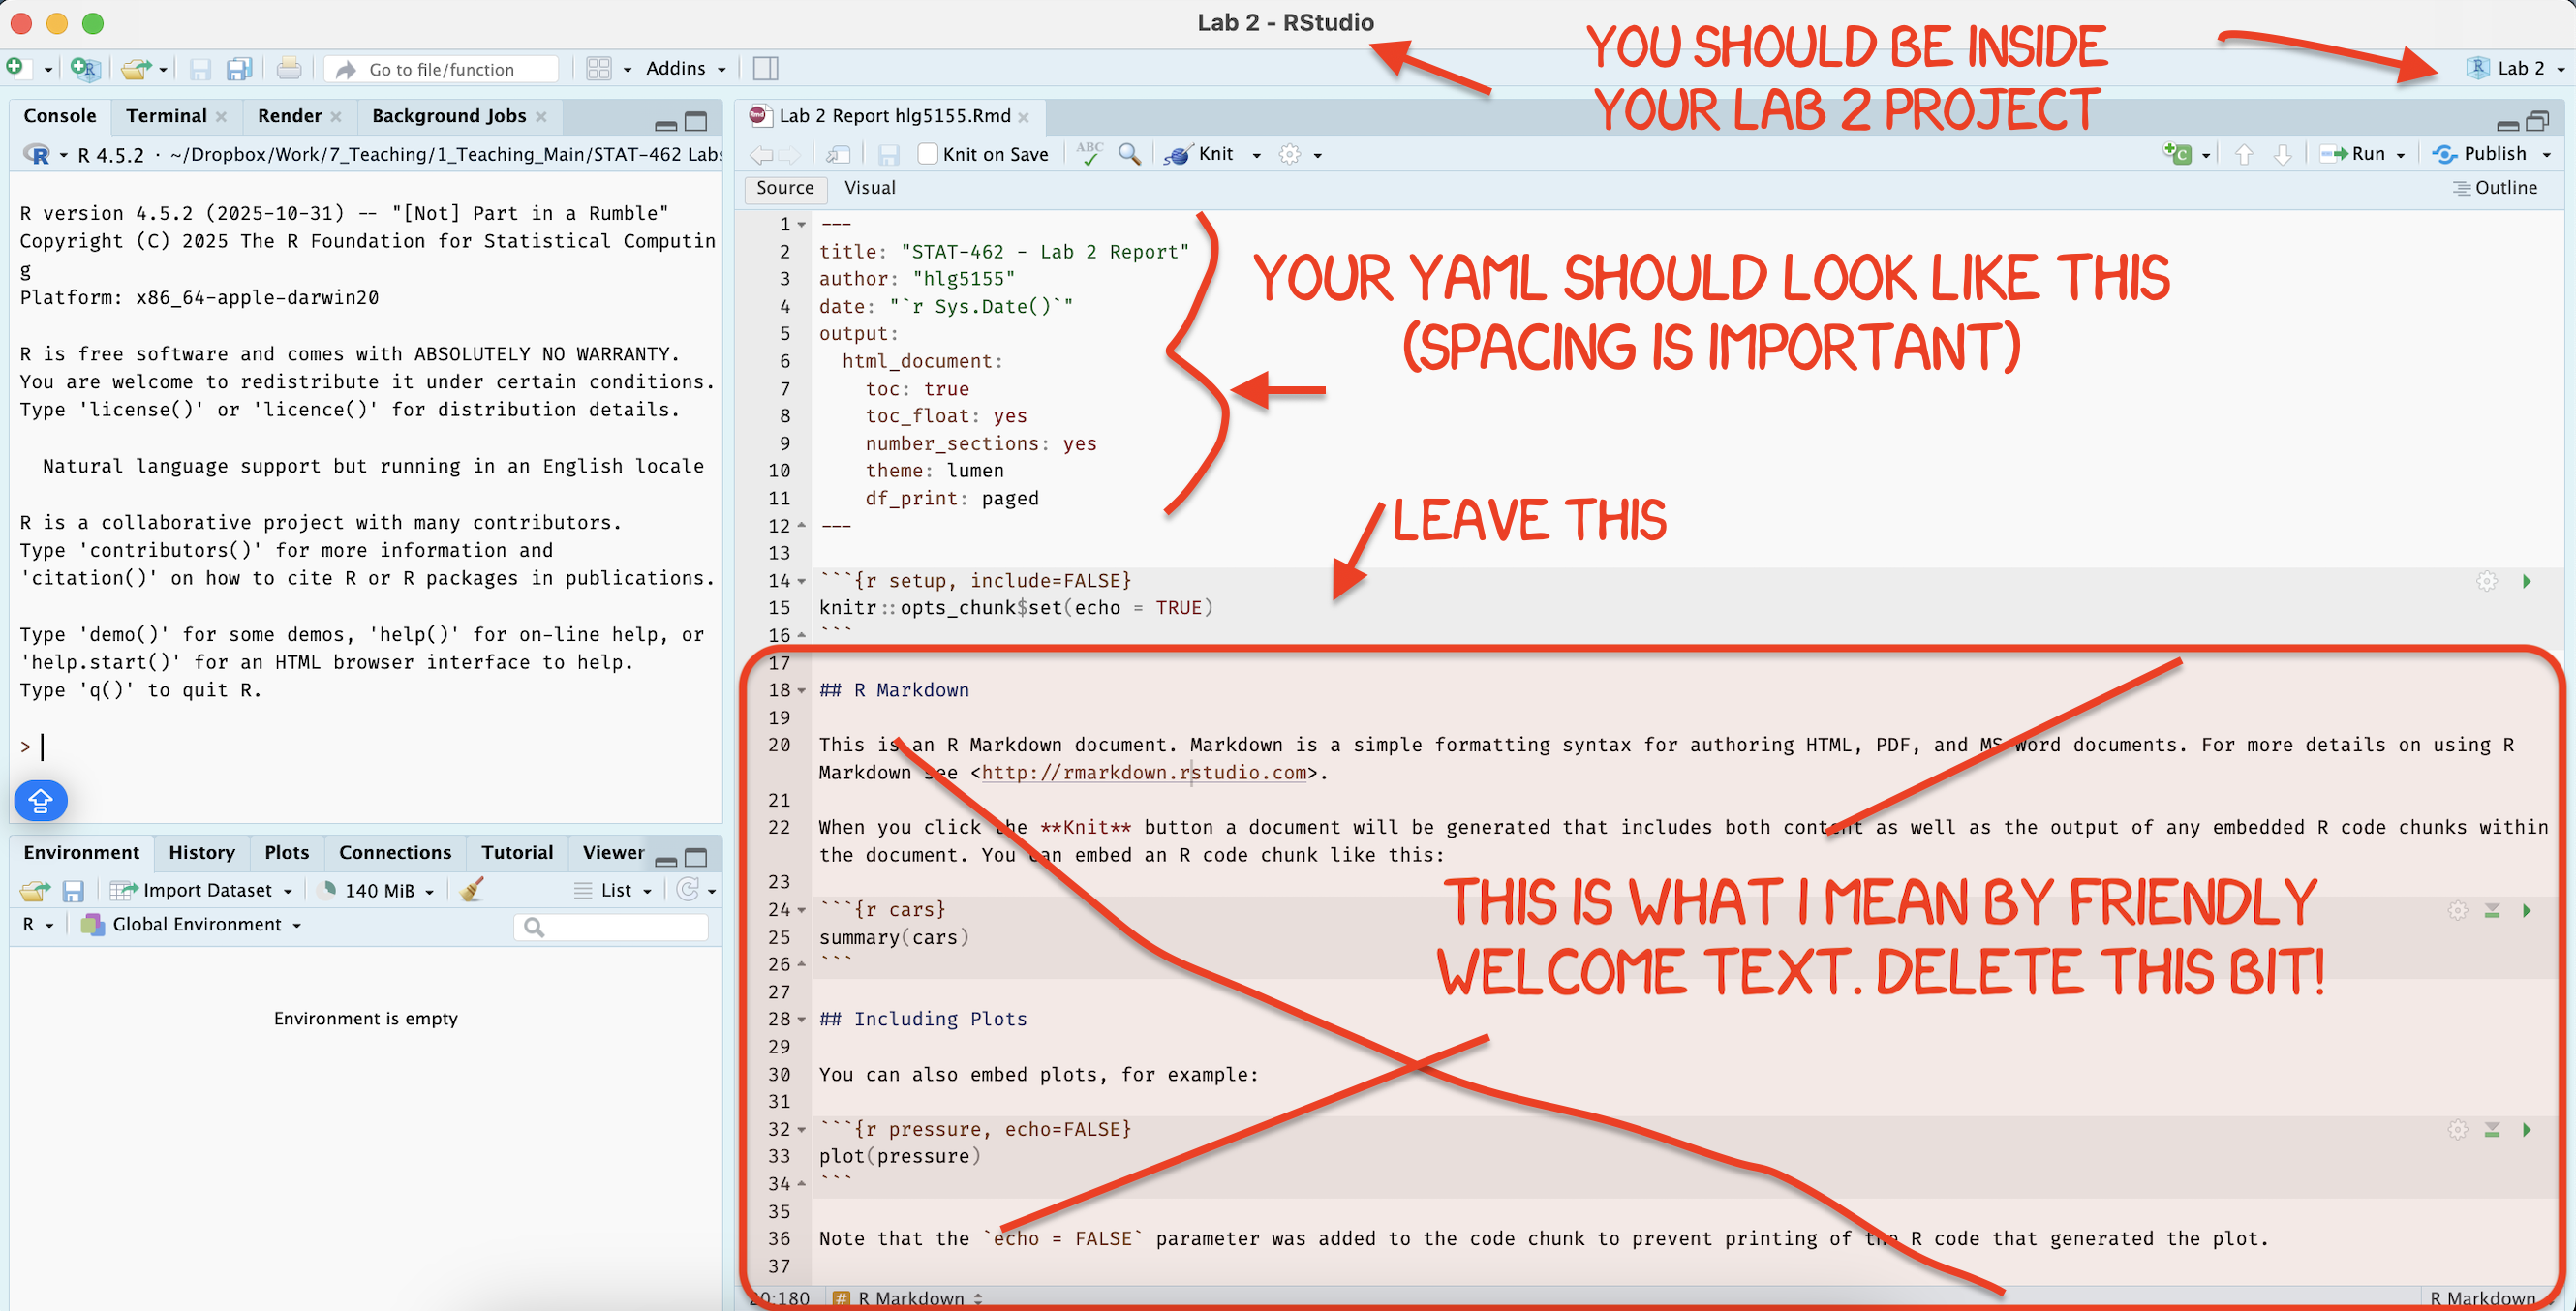
[3C] Using the YAML tutorial, edit the YAML code to include, A title, your author name, automatically created today’s date, a floating table of contents, numbered sections (this won’t appear until you start typing section headings) and the lumen theme. (See the screenshot below)
[3D] Now you are going to delete all “the friendly welcome text” (leaving the code at the top), so you have space to write your answers. (see the screenshot below)
-
[3E] Now, lets set up your report structure.
-
Write the. following three level-1 chapter headings (bold), with the sub-headings as Level-2. Remember that to do this in
sourcemode, you need to use a single # for level 1 and a double ## for level 2. If you are invisualmode, type the headings, then click on that line, and click the little arrow next to Normal. *see screenshot below)-
Plant Sales
- Data Description
- Data summary
- Quality control
- Exploratory Analysis
- Initial Regression
-
-
[4F] Click knit. This should work, ask you to save (then click knit again) and create a html file in your lab 3 folder AND show you it on your screen. IF YOU HAVE PROBLEMS ASK FOR HELP
[4G] Close down the html file so that you are back in your lab report again.
STEP 4: Get the input data
- [4A] Go to Canvas Lab or click this link to download “advertising.csv”. Put it in your Lab 3 folder.
2. SELLING HOUSEPLANTS
Houseplants are the new big thing and you’re going to make the world want to buy them! You are a top advertising executive at Leaves&Co and you have been collecting data on how well your marketing campaigns have been running.
You have run 200 marketing campaigns over the last few year. For each one, you recorded:
- How much you spent (in units of thousands of dollars) on
- TV adverts
- radio adverts
- and newspaper adverts
- How many houseplants were sold (in thousands of plants).
- You also know the “X-Factor” of how popular that plant was at the time (percentage popularity),
- And you know the general height of type plant in inches.
Your job now is to explore the data work out which type of advertising campaign is the most effective.
Your Answer format
Imagine this is a real report in an advertising company. You will be graded on the professionalism of your final report.
In all of your answers below, I expect good formatting, appropriate units and full sentences to explain your answers. For example, please make sure that you use headings and sub-headings to make your lab easier to follow and grade.
You are welcome to use any/all of the markdown features we have learned so far, for example equations, text formatting, pictures, code-chunk options or anything else that makes your report look more professional.
All the methods to answer these questions are either things you have done in previous labs or they are in the Tutorials.
Step 2.1: Read in data
- Read the data into R and assign it to a variable called “adverts”. See this tutorial on reading in data Tutorial_CSV
Step 2.2: Exploratory analysis/study design
Summarize the the dataset using R and suggest any quality control issues (e.g. unusual values, missing data etc). For summary commands, see Tutorial 5)
Write up your study design e.g. object of analysis, sampling frame, the potential population your CEO has in mind, variables (and units.), sample size.
Step 2.3: Quality control
You should have noticed a few issues with your dataset.
Use Tutorial 8 on filtering to remove the row containing the impossible data point (hint use the tidyverse option)
Use the “na.omit” command on “adverts” to remove any rows containing missing values. (see Tutorial 5 or look here (https://www.r-bloggers.com/2024/12/how-to-use-na-omit-in-r-a-comprehensive-guide-to-handling-missing-values/).
In the text below your code, record what you did, eg how many rows were removed? Why? Why do you think -999 wasn’t a “real” value.
Step 2.4: Exploratory analysis
Now that you have tidied your data, repeat your summaries of the dataset as a whole
Create a professional histogram of each variable and underneath each one, write a few sentences describing the each variable and anything you see. (See Tutorial 8 on histograms).
Step 2.5: Initial scatterplots
You are trying to predict sales.
FOR EACH PREDICTOR (TV, Radio, Newspaper, Plant height)
Use the
lm()command to create a simple linear regression model to predict sales (See Tutorial 11)Create a professional scatterplot for each of the others against your response including the line of best fit (for scatterplots, see Tutorial 8 Scatterplots)
Underneath comment on the relationship that each variable appears to have with sales, and describe the form/strength/direction/features of the scatterplot.
Write out the equation of each model, explaining what all coefficients mean in the context of the problem),
Discuss whether you think each model meets the LINE assumptions from what you see, showing me you understand what each assumption is.
Hint, think about what I have asked you to do in past labs to answer this.
Step 2.6: Favourite model
Out of the three models, where do you see the greatest increase in sales if you increase the advertising budget?
Provide evidence to justify your answer (thinking about uncertainties on your estimate).
Which model explains the most variability in the sales data? Provide evidence to justify your answer.
Are there any issues with your answers (e.g. are all the models valid? - there might be no issues! I genuinely can’t remember how I set the data)
Step 2.7: Peace lilies
- You have a new client who needs to sell 8000 peace lilies but hates newspapers. Conduct an hypothesis test to assess whether you typically sell less than 8000 plants in a situation where you spend zero-money on newspaper advertising. You are happy to be wrong one time in 25. Can you advise your client it is OK to not advertise in newspapers?
Hint, this is VERY similar to the example here: Tutorial 11 tests)
Step 2.8: TV fears
- Another client is skeptical of TV. Use the ANOVA table output to conduct a hypothesis test to examine if there is evidence to suggest a relationship between TV advertising and plant sales at a significance of 1%.
Hint, see week 6 lecture notes and Tutorial 11 tests)
3. WHAT TO SUBMIT
If you are using your own laptop
Press knit one final time. You will have created two files; a .Rmd file containing your code and a .html file for viewing your finished document.
Find the html and RmD files in your Lab 1 folder on your computer. Double click the html file to open it in your browser and check it’s the one you want to submit.
You need to submit BOTH of these files on the relevant Canvas assignment page.
You can also add comments to your submission as needed on the canvas page, or you can message Dr G.
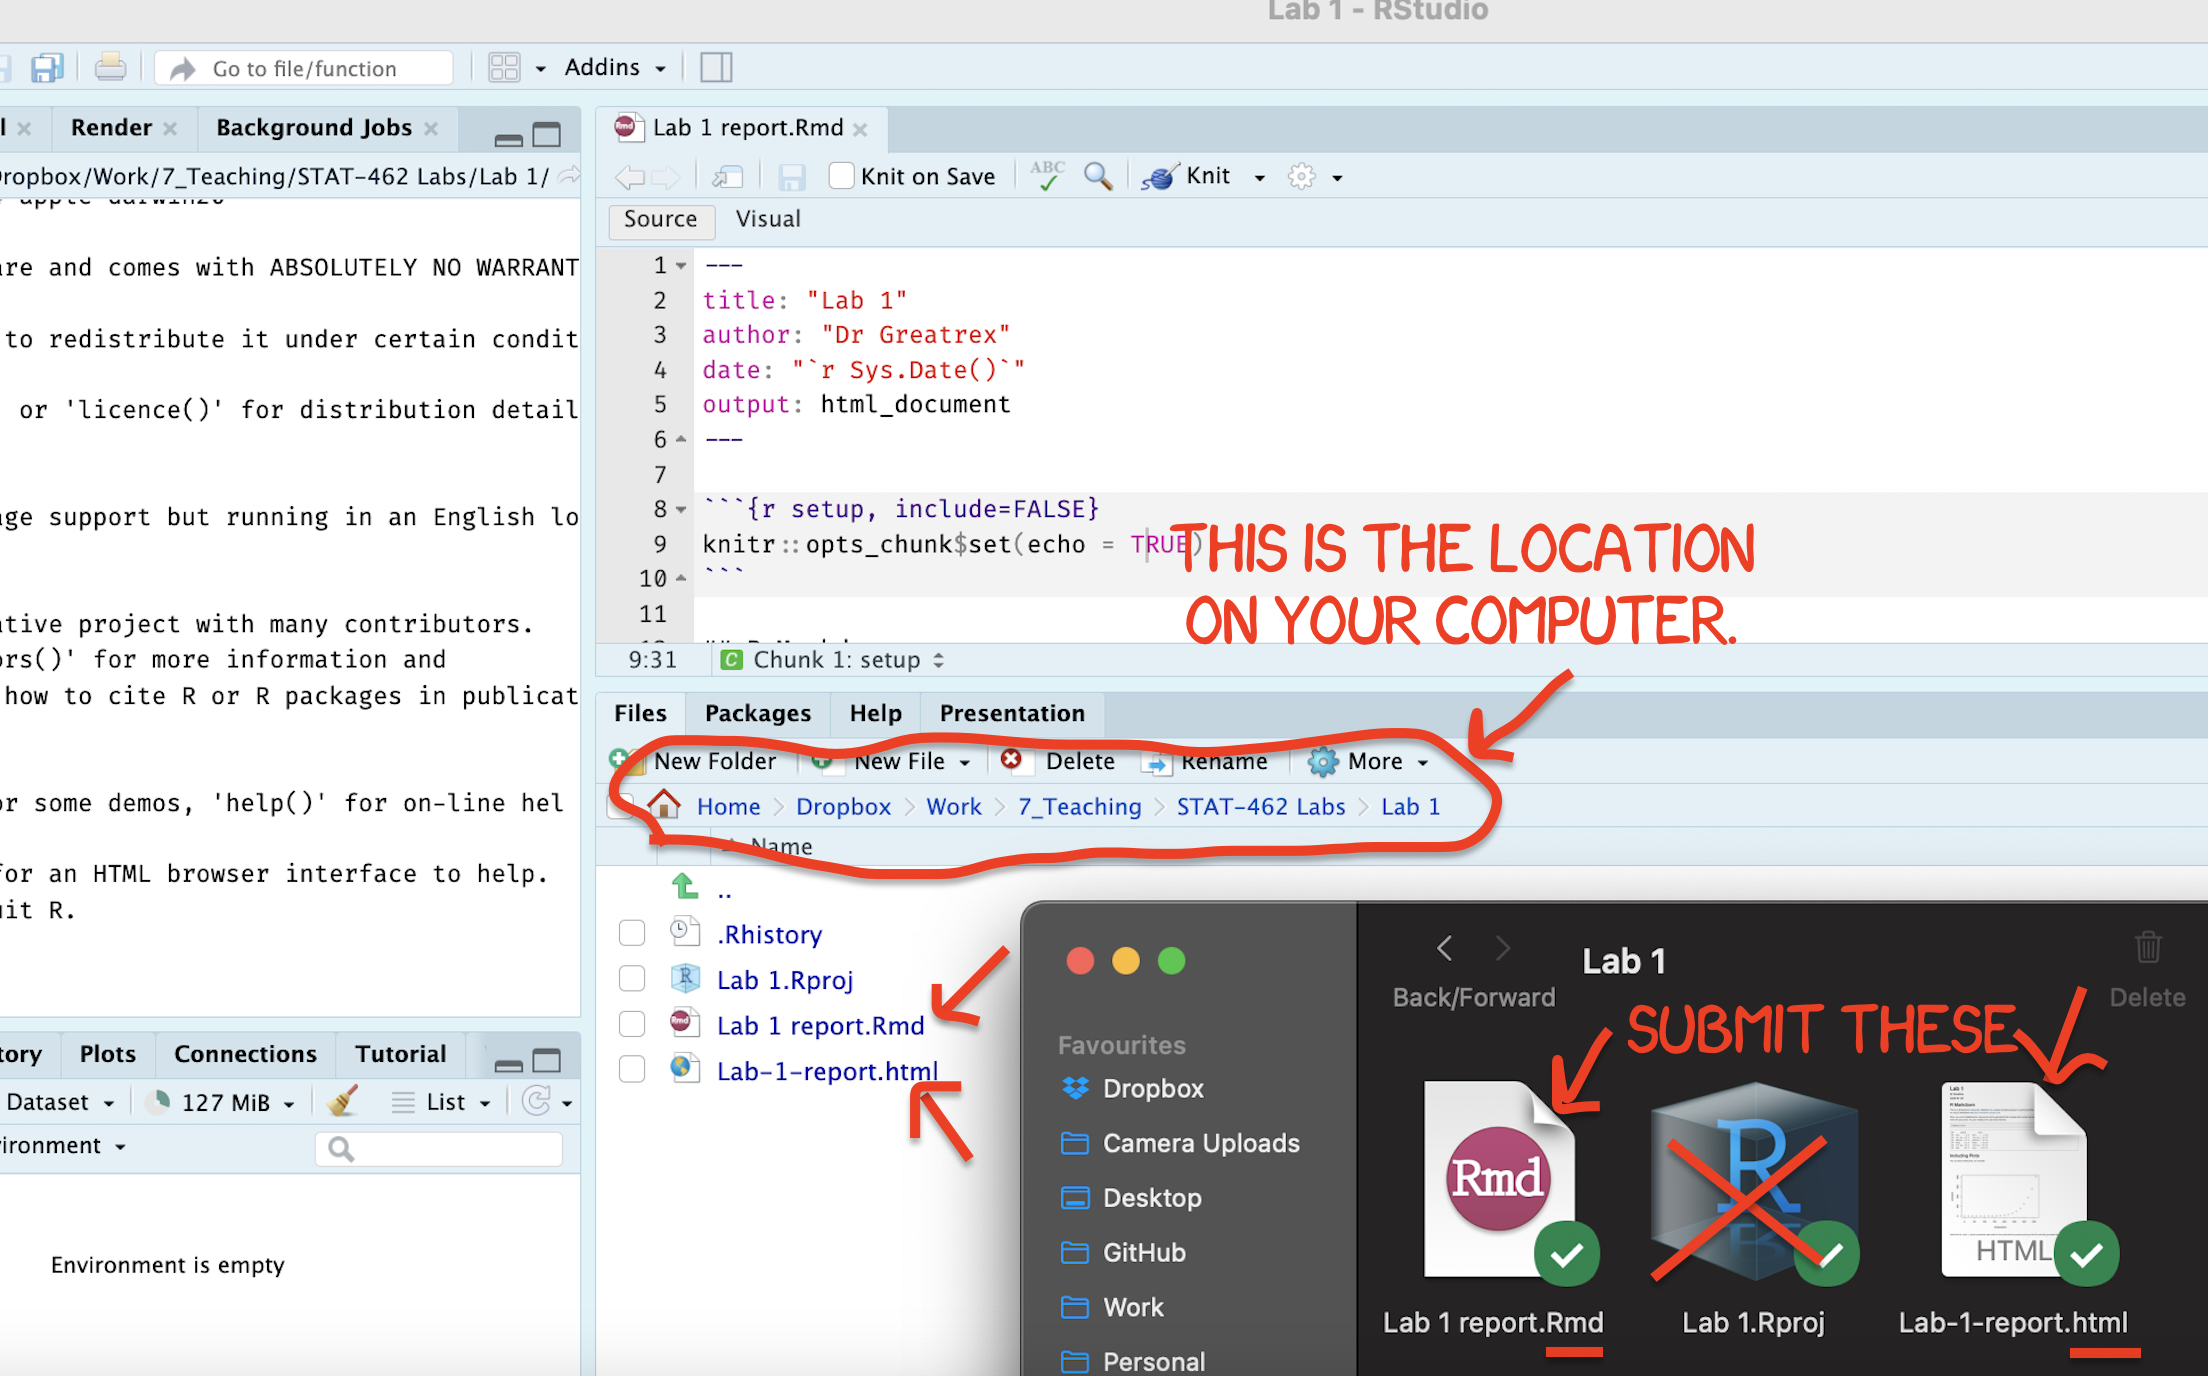
Figure 0.14: Find them in your STAT462 folder on your computer
If you are using Posit Cloud online
Press knit one final time. You will have created two files; a
.Rmdfile containing your code and a.htmlfile for viewing your finished document.Go to the files tab an click on the little check-box by the RmD file. Then click the blue “more button” and press export. Save onto your computer.
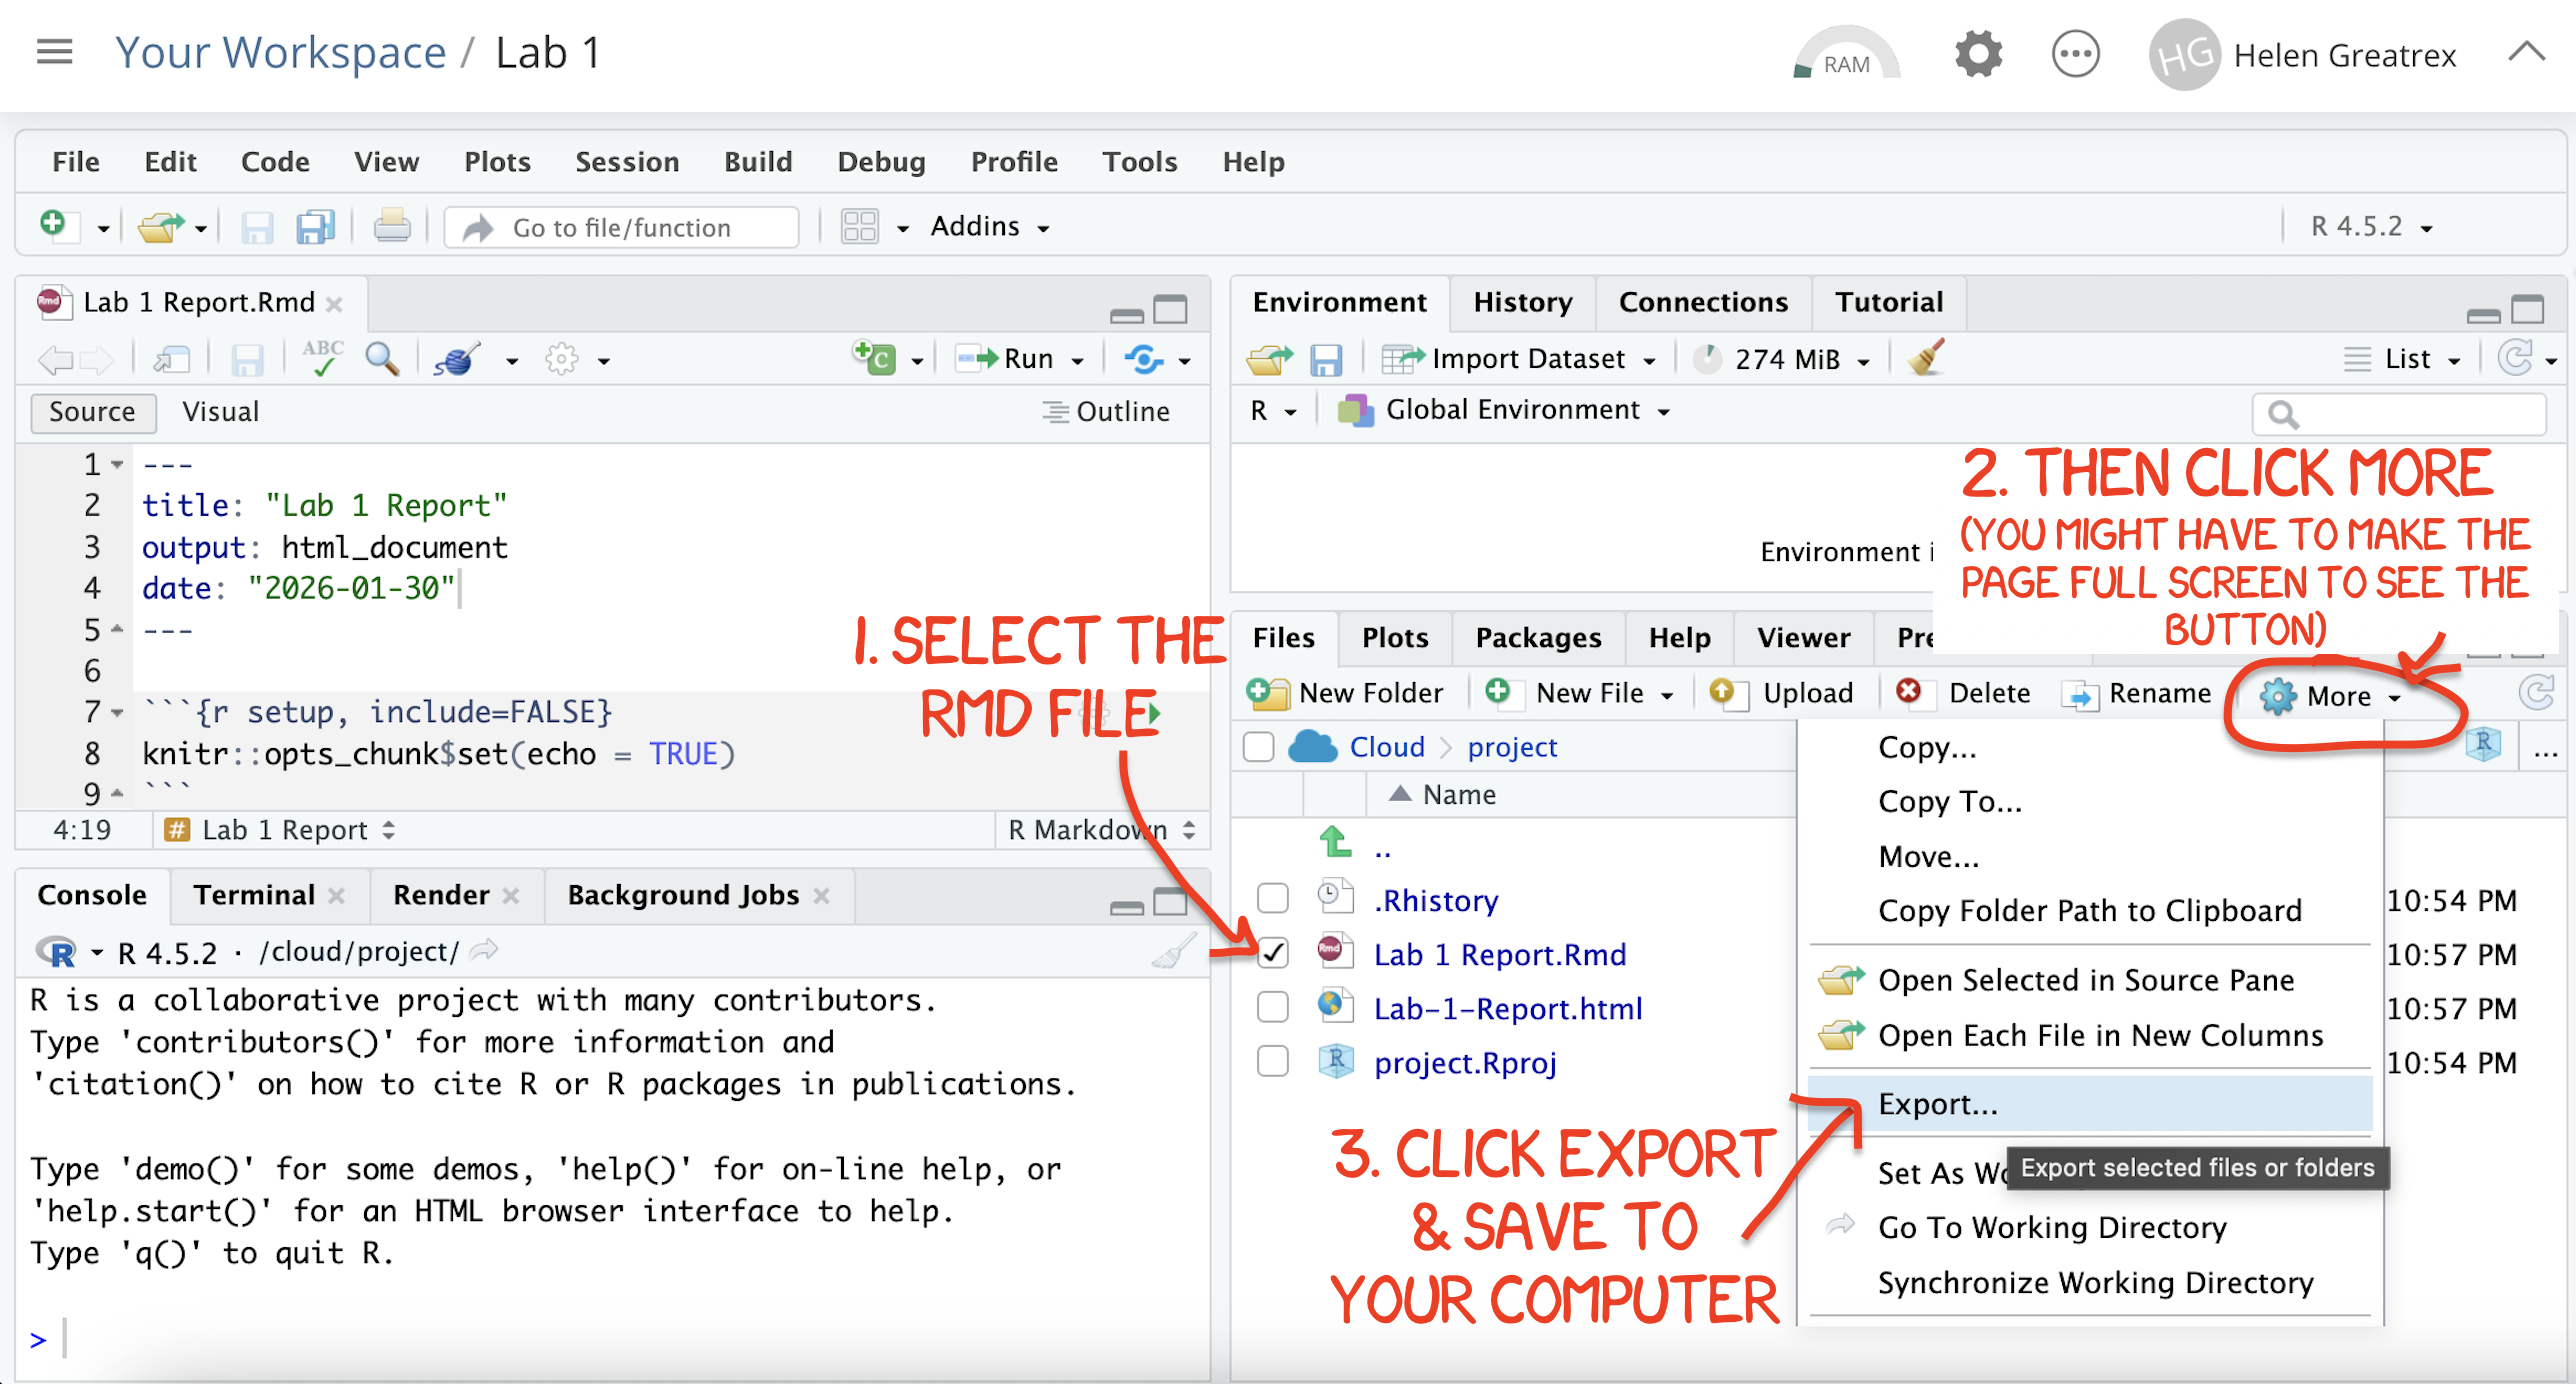
Figure 0.15: How do download the files from PositCloud
- Uncheck the .RmD box and click the box by the html file. Then click the blue “more button” and press export. Save onto your computer.
You need to submit BOTH of these files on the relevant Canvas assignment page.
You can also add comments to your submission as needed on the canvas page, or you can message Dr G.
4. CHECK YOUR GRADE!
RUBRIC
This is how you will be graded (percent)
HTML FILE SUBMISSION - 10 marks
RMD CODE SUBMISSION - 10 marks
-
MARKDOWN/CODE STYLE - 10 MARKS
How to get full marks for this:Your YAML code is working e.g. when you press knit, you see your author name, a table of contents etc etc (see step 4)
-
Your code and document is neat and easy to read. LOOK AT YOUR HTML FILE IN YOUR WEB-BROWSER BEFORE YOU SUBMIT. For example:
There is a spell check next to the save button.
You have written in full sentences and it is clear what question your answers are referring to.
You have included units!
You have included formatting like headings/subheadings and bullets. Many people make typos with the headings. The easiest way to do it is to use visual mode, then highlight the text and click Header 1, Header 2 etc.
-
EXPLORATORY ANALYSIS/QUALITY CONTROL - 10 MARKS
You provide a clear and appropriate summary of the dataset using R. You use relevant commands (such as
summary, tables, or counts) and correctly describe the main characteristics of the data. Your work shows that you explored the dataset thoughtfully and that you explained any code output in the text.You clearly identify potential quality issues (such as unusual values, impossible values, or missing data). Your explanation shows that these issues were discovered through inspection of the dataset, and you provide clear reasoning for why they may represent problems.
-
INITIAL ANALYSIS/LINE ASSUMPTIONS - 15 MARKS
-
You have created a simple linear regression model using
lm()for each predictor (TV, Radio, Newspaper, and Plant height) to predict sales. For each predictor, you produced a clear and professional scatterplot of the predictor against sales and included the fitted regression line. Under each plot, you described the relationship between the predictor and sales. Your description addresses the direction, form, and strength of the relationship and notes any important features visible in the scatterplot (such as clustering, curvature, or unusual points).You wrote out the regression equation for each model and explain what each coefficient means in the context of predicting sales. You also discussed whether the LINE assumptions appear reasonable based on the scatterplots and model output. Your explanation shows that you understand what each assumption represents and how the plots help you evaluate them.
-
-
PEACE LILIES - 10 MARKS
-
You correctly set up and conducted a hypothesis test to assess whether expected sales are typically less than 8000 plants when no money is spent on newspaper advertising. You clearly stated the null and alternative hypotheses, identified the significance level and used the regression output appropriately to perform the test.
You correctly interpreted the result in the context of the problem and explained what the statistical result implies for the client’s decision about newspaper advertising. Your conclusion clearly answers the practical question: whether it is reasonable to advise the client that avoiding newspaper advertising is acceptable based on the evidence from the data.
-
-
TV FEARS - 10 MARKS
-
You correctly used the ANOVA table from the regression output to conduct a hypothesis test examining whether there is evidence of a relationship between TV advertising and plant sales. You clearly stated the null and alternative hypotheses, identified the significance level, and correctly interpreted the F-test or p-value from the ANOVA table.
Your explanation shows that you understand what the ANOVA test is assessing in the context of regression. You provide a clear conclusion explaining whether the evidence suggests a relationship between TV advertising and plant sales.
-
-
CONCLUSION - 5 MARKS
-
You clearly summarised the main findings from your analysis in plain language appropriate for a non-technical audience. e.g. you highlighted the most important insights about the relationship between advertising channels and plant sales and explain what the results suggest about effective advertising strategies.
Your summary focuses on the practical implications of the analysis rather than repeating technical output.
-
[80 marks total]
Grade meaning
Overall, here is what your lab should correspond to:
| POINTS | Approx grade | What it means |
|---|---|---|
| 98-100 | A* | Exceptional. Above and beyond. THIS IS HARD TO GET. |
| 93-98 | A | Everything asked for with high quality. Class example |
| 85-93 | B+/A- | Solid work but the odd mistake or missing answer in either the code or interpretation |
| 70-85 | B-/B | Starting to miss entire/questions sections, or multiple larger mistakes. Still a solid attempt. |
| 60-70 | C/C+ | It’s clear you tried and learned something. Just attending labs will get you this much as we can help you get to this stage |
| 40-60 | D | You submit a single word AND have reached out to Dr G or Aish for help before the deadline (make sure to comment you did this so we can check) |
| 30-40 | F | You submit a single word……. ANYTHING.. Think, that’s 30-40 marks towards your total…. |
| 0+ | F | Didn’t submit, or incredibly limited attempt. |